Hspice TUTORIAL
Output on Avanwaves
If we simulate the code in the previous page and use Avanwaves to look at the waveforms, we should see something similar to the waveform below.
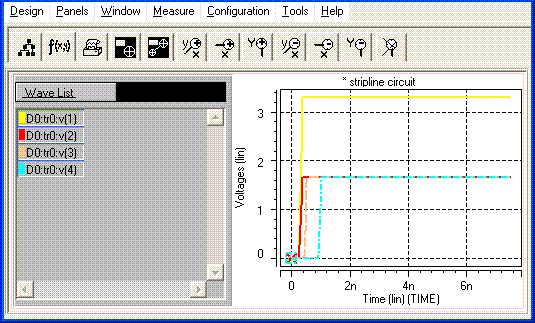
Figure - Simple transmission line simulation in hspice.
The line with amplitude 3.3V shows the voltage source. It starts rising at t = 250 ps. It has a rise time of 100 ps. As soon as it passes the 50 Ohm series resistance and hits the first transmission line, its voltage level is halved according to the input acceptance voltage equation
v = viZo/(Zo+Zs).
As a result, a voltage level of 3.3V / 2 = 1.65 V starts propagating the first transmission line and the second transmission line. At the receiver, the waveform is completely absorbed in the 50 Ohm termination resistor and there is no reflection. The rightmost waveform shows the final waveform at node 4.
In the next page we will see the output of this code in awanwaves.