Tom and Bob Chapter 2
CHAPTER 22.8 Tom and Bob
Tom You mentioned ISI in answer to my previous question. What is Inter Symbol Interference (ISI).
Bob - Tom, I think that the best way to understand a concept is by picture. So, I am presenting you two pictures and I will let you find the difference between them.
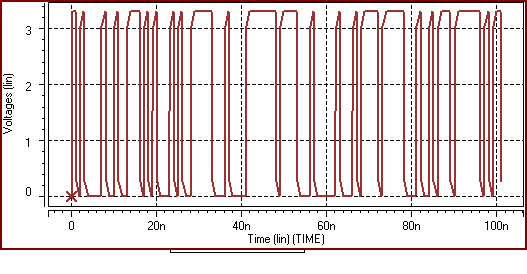 Figure 2.5 Data transition without any significant Inter Symbol Interference
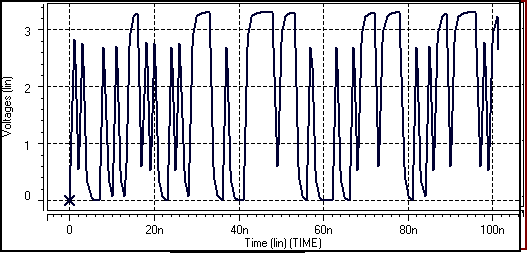 Figure 2.6 Data transition with Inter Symbol Interference
Both the pictures belong to a random data transition. Which of these two pictures you like more as a signal integrity engineer? I know you know the answer. The first picture obviously looks good. The second picture looks screwed up.
If the transitions are in quick successions, the amplitudes are smaller. When the transition pattern is like 1010101, the signal in not able to rise to its full value. The signal may also not rise to its full amplitude, if the signal passes though capacitive loads. The signal starts to rise slowly and before it could rise to full amplitude, the signal starts to fall. This keeps happening if the signal switches fast in 101010 like pattern.
Now consider the case when we have the data pattern like 0111110, i.e., a 0 followed by a long sequence of 1s. As the signal rises from 0 to 1, it keeps rising and reaches to full voltage amplitude and stays at that value. We see that the signal amplitude in this case is higher than that in the case where the pattern was 010101. RF Engineers paraphrase this fact as there is a signal loss and phase change which is a function of frequency. A pattern like 10101010 is equivalent to higher frequency. A 111100001111 like pattern is equivalent to a low frequency. At higher frequency there is higher loss.
Tom How did the two diagrams originate? What makes data transitions to become screwed like the one in figure 2-4.
Bob Both the diagrams were generated with hspice. Both had rise time of 250 ps and same transitions. In the second case, however, there is a 10 pf capacitor at the load which kind of screws the figure. The hspice code used to generate these diagrams can be accessed at
http://referencedesigner.com/books/si/hspice/isi_with_cap.sp
http://referencedesigner.com/books/si/hspice/isi_no_cap.sp
The Intersymbol Interference originates if the rise time is comparable to the time period of the signal. The Intersymbol Interference gets worse if there are capacitive loads or discontinuities.
Previous - Integrity of Point to Point Signal Next - Coupling of Traces